A good plan has detail. The more detail, the more precise the deviation and the faster you find where things went off track. We have been saying it for a long time and we stand by it: a plan broken down by cost centre, project or counterparty tells you much more at evaluation time than five lines with big numbers.
But you need to see that same plan once as five lines for a management meeting and another time as the full breakdown. The detail you need when hunting for a deviation is more of a burden when presenting at a meeting. Nobody wants to look at a table where they have to search for which rows are totals and which are items.
Until now, that meant clicking down row by row. And on the way back, the same in reverse, or reloading the screen and starting over.
From now on, you can do it with one click.
Where to find it
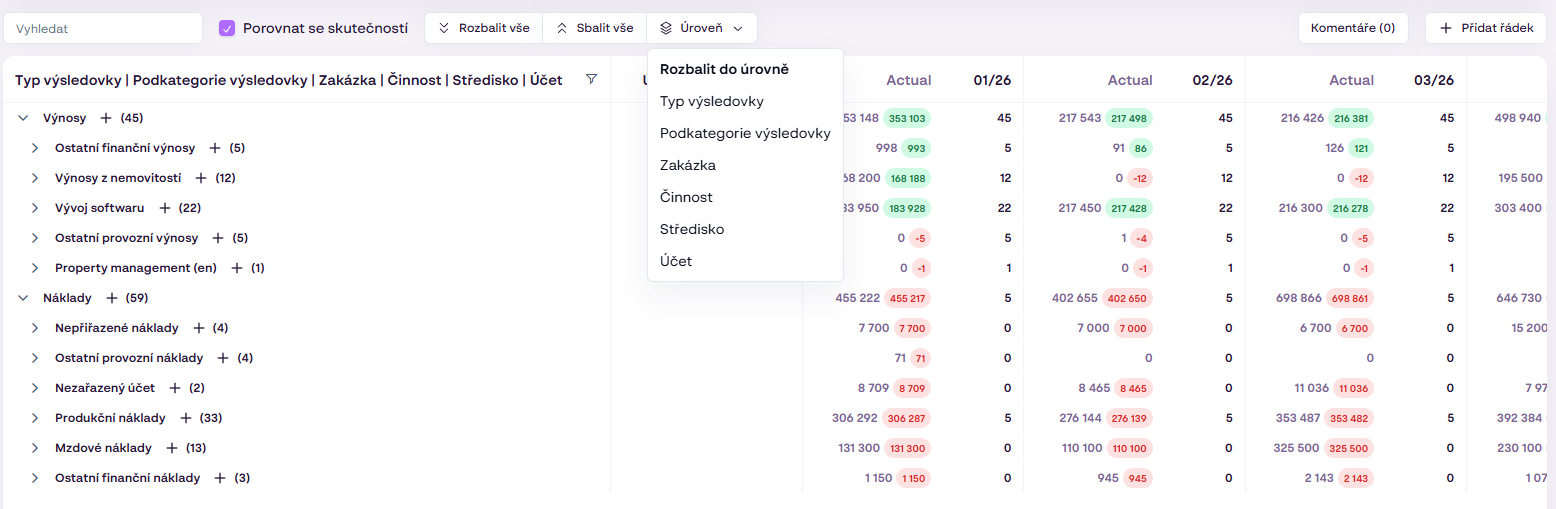
Above the plan table you’ll find a group of arrows and a level selector.
How it works
- The down arrow expands one level. One click shows the next sub-level for all rows at once. Another click takes you one floor deeper, down to the lowest detail the plan contains.
- The up arrow collapses one level. The opposite direction. From the breakdown into individual items you get back to the summary without closing each branch separately.
- It applies to the whole table. You don’t have to keep track of which branches are open and which aren’t. All rows are at the same level of detail, so the plan can be read, presented and shared without explaining why one category is expanded and another isn’t.
- Expanding individual rows by hand stays. When you need a breakdown for just one category, you do it as before.
- Set the level you want to expand the table to. From the menu, choose how deep the table should be expanded. If, for example, you want to expand all rows down to level 3, one click is still enough.
Why we built it this way
We considered a single button that expands everything down to the bottom. That works for small tables, but for a plan with several dimensions it generates hundreds of rows and you end up looking for where you actually are.
Going one level at a time gives you something else we value in reporting. The table stays readable at every moment and comparable with itself. When you are one level down, you know exactly which level of aggregation you are looking at, and the totals above make sense. It is the same principle our whole reporting is built on: straightforward logic that everyone who takes part in the finance process understands, not just the person who designed it.
Three situations where you’ll use it
Management meeting. Collapse the plan to the top level and project a few rows. When someone asks about one category, expand one level and answer right in the data instead of promising to look into it and send an email.
Hunting for a deviation. You see that costs have overshot the plan. By expanding step by step, you go from the category through the subcategory to the specific cost centre or counterparty. Each step narrows the space where you look for the cause.
Checking the plan before sending it. Before sharing the plan with investors or management, go through it top to bottom, level by level. You’ll quickly see where the structure is too coarse to show you later what actually happened, and where, on the contrary, you are planning detail that nobody will evaluate.
What we recommend
Use both positions as two reading modes of one plan. Collapsed for the meeting, the presentation and the snapshot in the report, where a few rows should give the picture within seconds. Expanded when you are looking for a specific number and need to get down to the cost centre, project or counterparty.
And if you have so far planned at a higher level only because the detailed table was hard to read, try building the plan in more detail. The reason that kept you away from detail is gone, and more precise deviations are usually worth it.