Before you start
- Permissions: you need access to the statement you build on (for example the View income statement permission for the company).
- Time required: 5–10 minutes.
- Have ready: an idea of the row hierarchy (for example Category → Cost center → Account), the comparison you want to see (previous month, last year, plan) and the dimension filters.
Set up categorization and account mapping first. A custom report is built on your management categorization. Until your accounts are mapped to income statement categories and subcategories, the report will be created, but the rows stay empty or every value collapses into Unassigned revenue and Unassigned costs, and indicators such as gross margin become meaningless. Set up the mapping in the company detail under Categorization › Mappings (see Setting up the income statement structure and Mapping accounting data for the income statement and cash flow).
Opening the custom report wizard
- Open the statement you want to build on from the Reports menu, for example Income statement.
- Set the company selection and the period selection in the bar above the table. For a consolidated view select several companies or Select all and confirm with Apply.
- In the Saved reports and filters bar click Show.
- Click Create custom report. The dimension wizard opens.
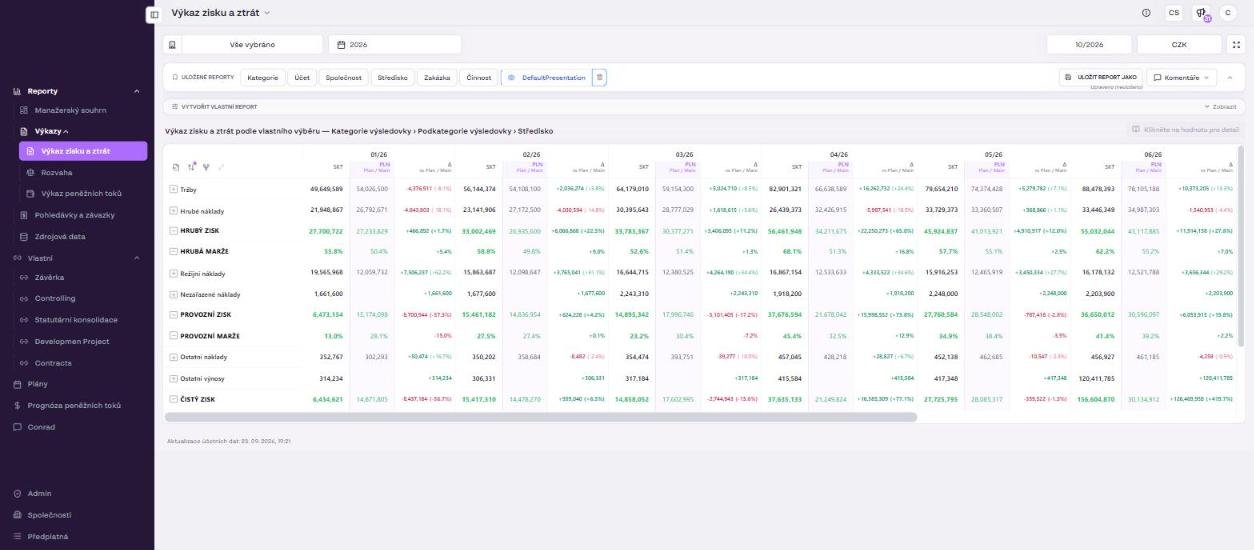
The report is configured in three consecutive steps: first you define the row structure, then the values and comparisons, and finally the filters.
Step 1: Row structure
You can define the row hierarchy up to 5 levels deep. For each level you choose one parameter (dimension); parameters can be combined and ordered freely across levels. Available parameters:
- Income statement category and subcategory
- Cost center
- Account (account number and name)
- Project (order)
- Activity
The list of parameters may differ depending on your company setup (for example whether you use cost centers, projects and activities).
Example: the hierarchy Income statement category → Cost center → Account gives you a report where costs first break down into categories, inside each category into cost centers, and only at the lowest level into individual accounts. The chosen hierarchy is shown in the heading above the table, for example Income statement by custom selection — Income statement category › Income statement subcategory › Cost center.
Step 2: Values and comparisons
Below the row structure you define which values the report should display.
Time comparison
- current month vs. previous month,
- current month vs. the same month of the previous year,
- monthly values together with cumulative values from the start of the year (year-to-date, YTD).
Plan scenarios
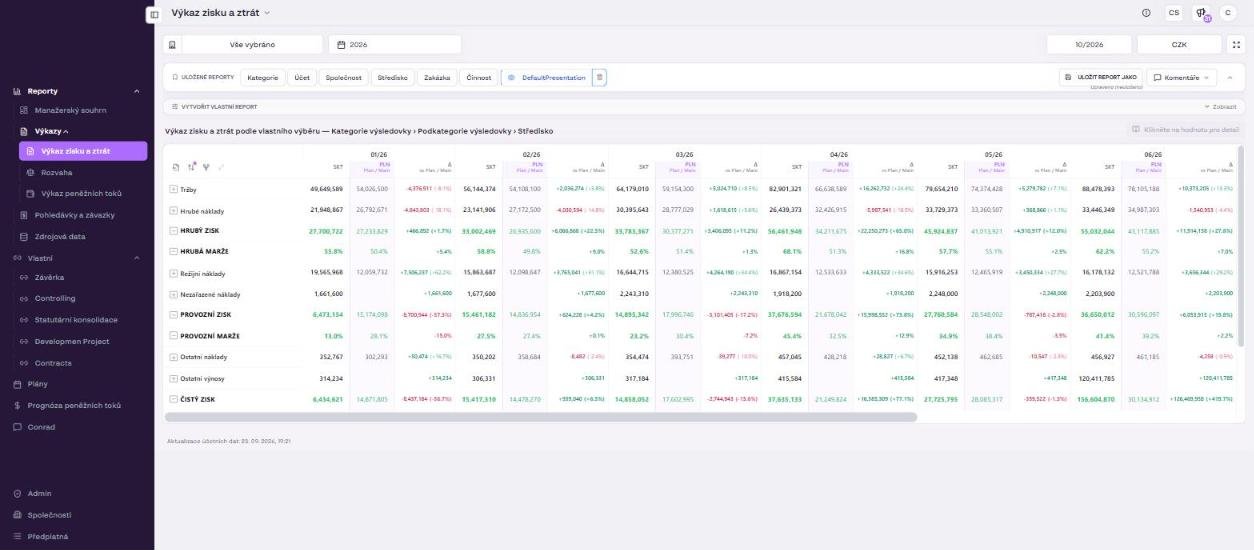
Choose one of the plan scenarios your company has defined in income statement Plans (for example the Main scenario, Budget, Forecast 1). The list reflects what you have created. In the income statement, next to the Actual column (SKT), the report then shows the Plan column (PLN) of the selected scenario and the Δ column (difference in absolute terms and in percent; positive values in green, negative in red).
Step 3: Filtering and consolidation
The report lets you target exactly the data you are interested in:
| Filter | Purpose |
|---|---|
| Consolidation group | Shows data for the whole group of companies (the parent entity and its subsidiaries). |
| Intercompany | Filters values at the level of intragroup relations; use it when checking the elimination of mutual transactions. |
Lists: dimension filters
Under the Lists button you find the filters for individual dimensions. Each dimension shows the number of available values, so you immediately see how many there are in the data.
| Dimension | What it filters |
|---|---|
| Activity | Activity. Records without an assigned activity are listed under the value no activity. |
| Cost center | Cost center. |
| Project | Project or order. |
| Company name | Company; useful with a consolidation group. |
| Account | Specific accounts from the chart of accounts. |
For each dimension you can search the values and use Select all. The Clear all link in the header removes all dimension filters at once.
Tip: a high number of values in a dimension (for example 210 cost centers) usually means it pays off to filter before breaking down the row structure. Otherwise the table becomes hard to read.
Display units
In the Units control panel in the top right you switch the units in which numbers are displayed:
| Option | Meaning |
|---|---|
| # | Base units (full amounts). |
| K | Thousands. |
| M | Millions. |
The unit setting is part of the saved report. You switch the report currency with the currency button (for example CZK) in the bar above the table.
Saving the report
The report must be saved. Until you save it, the whole configuration (row structure, selected values, filters and units) exists only temporarily and you lose it when you refresh or leave the page. You recognise an unsaved state by the Modified (unsaved) indicator in the saved reports bar.
- In the Saved reports and filters bar click Save report as.
- Enter a name for the report.
- Choose the report type: Visual report or Static report (see the table below for the differences).
- Check the hierarchy the report is saved with, for example Income statement category → Income statement subcategory → Account.
- Confirm. The report appears as a chip in the Saved reports section, where you can return to it at any time.
Visual or static report
The type matters: it decides whether the report stays live or gets frozen.
| Visual report | Static report | |
|---|---|---|
| What is saved | Only the report configuration (filters) | Configuration and data |
| Company, period, currency | Stay live | Frozen at the moment of saving |
| Data | Updated with every accounting data refresh | Frozen at the moment of saving |
| Editing after opening | The report remains editable | Filters are locked, only comments remain active |
| Comments | Not available | Can be created and saved |
For both types the following is saved together with the hierarchy: the selected comparison, intercompany settings, the source of values (actuals / adjusted data), the plan scenario, dimension filters and units. A static report additionally freezes the company, the period and the data at the current moment.
- Choose a visual report for a view you return to regularly and want to see current figures in, for example a monthly overview of costs by cost center.
- Choose a static report for a moment you need to fix and comment on, for example a month-end close, material for a management meeting, or the version of the numbers sent to the board. Working with comments is described in Comments in static reports.
Tips and common mistakes
Drill-down: the Click a value for details button works in custom reports too. Click a number in the table to open the detail of the accounting entries that make up the value.
Expanding and export: the icons in the top left corner of the table export the data to Excel (Export data), sort, and expand or collapse the hierarchy by one level. Use + on a row to expand its child levels.
Predefined views: the Saved reports section also contains default views by dimension (Category, Account, Company, Cost center, Project, Activity). Often it is enough to start from one of them and just adjust the filters.
Frequently asked questions
Why does my report have empty rows, or why did everything fall into Unassigned costs?
Your accounts are not yet mapped to income statement categories and subcategories. Complete the mapping in the company detail under Categorization › Mappings and reopen the report.
Can I edit a static report later?
No. A static report has locked filters, company, period and data. You can only add and save comments. If you need a different configuration, create and save a new report.
Where do I find saved reports?
On the page of the respective statement, click Show in the Saved reports and filters bar. Saved reports are displayed as chips in the Saved reports section.
Can I compare actuals with the plan in the report?
Yes. In the Values and comparisons step select a plan scenario. The statement then shows the Plan and Δ columns. Create the plan first as described in Income statement plan.