Before you start
- Permissions: the report is visible to every user (Reader, Editor and Administrator) who has the View source data permission enabled for the company.
- Time required: a basic check takes 5–10 minutes.
- What to prepare: control figures from your accounting system – the number of journal entries and turnovers for the period being checked.
What you will find in the report
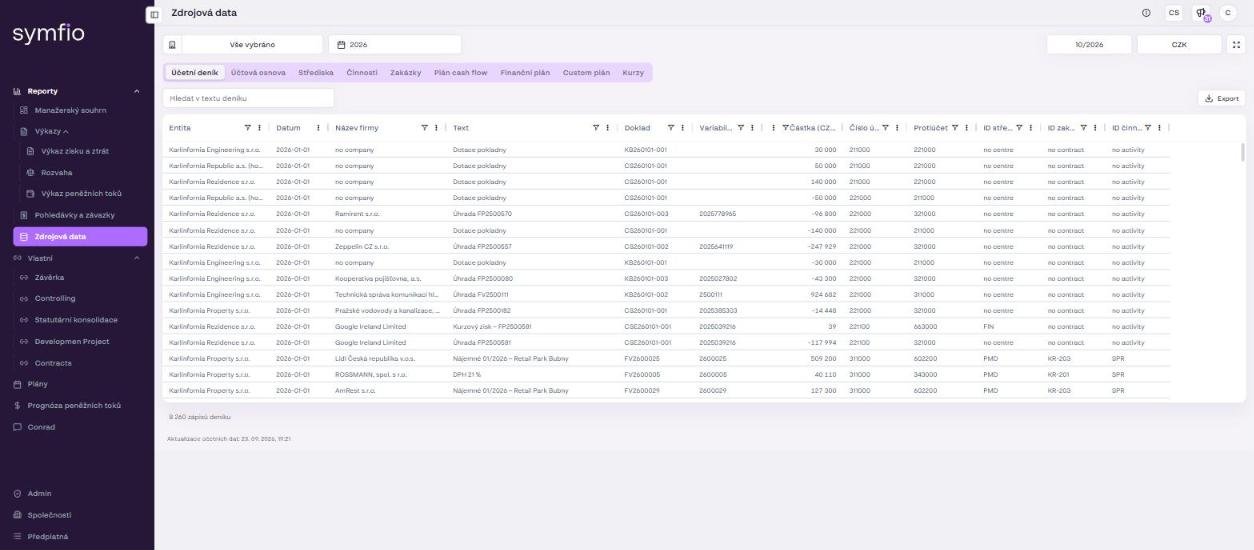
Open the report from Reports › Source data. At the top is the common report bar: Company selection, Period selection, currency and full-screen mode. The content is divided into tabs:
| Tab | Content | What to look at |
|---|---|---|
| Accounting journal | Individual accounting entries: Entity, Date, Company name, Text, Document, Variable symbol, Amount, Account number, Counter account, Cost centre ID and more. | Number of entries, first and last date, missing cost centres and counterparties. |
| Chart of accounts | Accounts loaded from the accounting system with numbers and names. | Whether the chart contains all accounts used in the journal. |
| Cost centres | List of cost centres. | Completeness and correct names. |
| Activities | List of activities. | Completeness. |
| Projects | List of projects / jobs. | Completeness. |
| Cash flow plan | Values from cash flow forecasts. | Whether the planned months are filled in. |
| Financial plan | Income statement plan, including plans from external sources. | Whether the correct scenario and period were loaded. |
| Custom plan | Custom plan data from external sources. | Whether the structure matches expectations. |
| Exchange rates | Currency rates used to convert entities in foreign currency. | Whether a rate exists for every year and currency you use. |
Working with the journal table
- Search in journal text (Hledat v textu deníku) – full-text search in the entry texts. Useful for finding a specific document or supplier.
- Column filters – every column has a filter and a menu. Filter, for example, only one account, one cost centre or one month.
- Entry count – below the table you see the total number of rows after filtering (e.g. “8 260 journal entries”). This is the number you compare with your accounting system.
- Export – downloads the currently filtered data to Excel for further checking or reconciliation with your accountant.
Checking after loading a new source
- Open Reports › Source data and in Company selection select only the company you are checking.
- In Period selection, set the period you entered for the data source (Period from–to) and click Apply.
- On the Accounting journal tab, compare the entry count below the table with the number of journal rows in your accounting system for the same period. Rows with a zero amount, which are not loaded, may explain a difference.
- Sort or filter the
Datecolumn and verify that the first and last entries match the selected period. - Filter the
Cost centre IDcolumn for empty values or the valueno centre. These are entries without a cost centre – in reports by cost centre they appear on a separate row. - Check the
Company namecolumn in the same way – the valueno companymeans an entry without a counterparty, which limits the Receivables and payables overview. - On the Chart of accounts tab, verify that all accounts were loaded. Accounts that are in the journal but missing from the chart are shown in reports by number only.
- If the company has a currency other than the reporting currency, open the Exchange rates tab and verify that a rate is listed for every loaded year.
Tips and common mistakes
Double the number of entries: If the entry count is roughly twice that of your accounting system, the company has two active data sources with the same period (e.g. an old and a new Excel). Deactivate one of them in Companies › Data sources.
Tip: When a specific item in the Income statement does not add up, click the value in the report (the “Click a value for details” button) – you get to the entries that make it up without manual filtering in Source data.
Note: Entities in foreign currency are converted into the group view using a fixed annual rate from the Exchange rates tab. If the intercompany balance does not net to zero, check the rates first and only then the postings.
Frequently asked questions
Why are there fewer entries in the journal than in the accounting system?
Symfio does not load rows with a zero or empty amount, nor entries outside the data source period. Also check that the data source is not deactivated and that the first refresh has already completed.
Can I correct anything in Source data?
No, the report is read-only. Make corrections in the accounting system or in the source Excel; the changes appear after the next refresh. Account names and their classification are edited in Categorization › Lists and Mappings.
Who can see Source data?
Every user who has the “View source data” permission enabled for the company. Since it contains individual documents, consider carefully who you enable it for.
How do I find out when the data was last updated?
The report footer shows “Accounting data update” with date and time. The breakdown per source is in Companies › Data sources in the Last updated column.