Before you start
- Permissions: the statements are visible to every user (Reader, Editor and Administrator) with the relevant access on the company:
View income statement,View balance sheet,View cash flow. - Opening: in the left menu go to Reports › Statements and choose Income statement, Balance sheet or Cash flow statement.
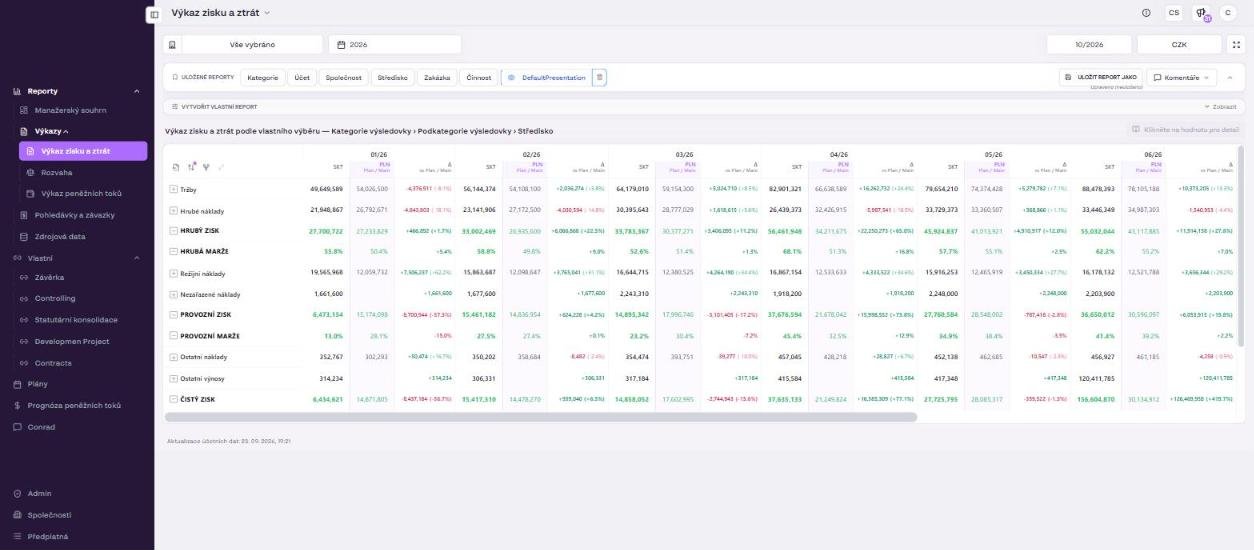
Company selection
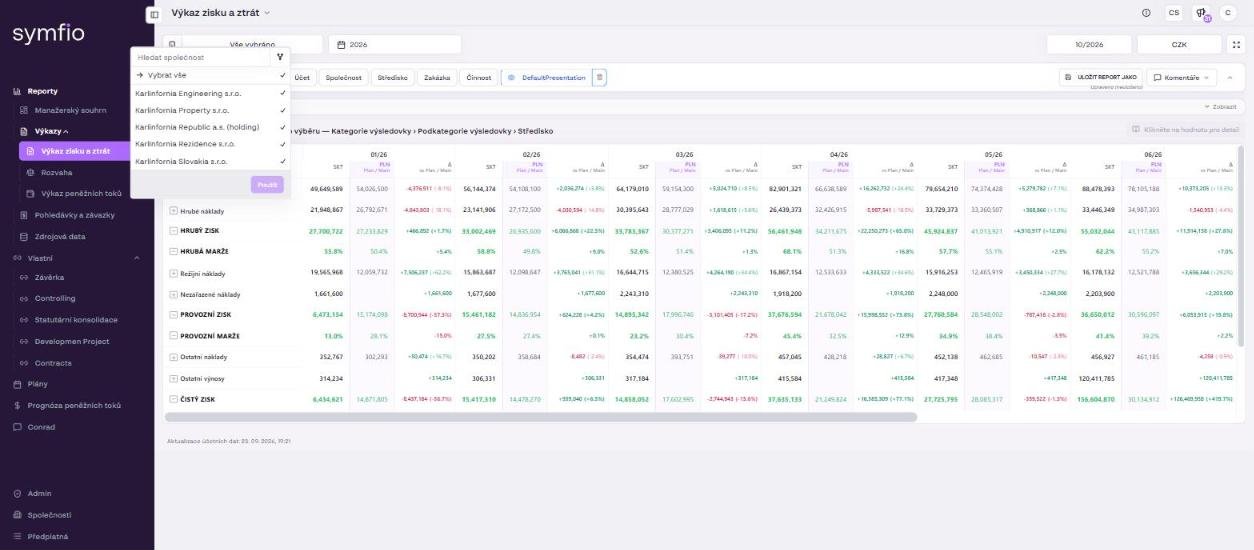
- Click the button with the building icon in the toolbar (text such as “All selected”).
- Tick one or more companies. Choose Select all to include every company you have access to.
- Confirm with Apply.
Selecting several companies creates a consolidated view – values are summed row by row. To break the figures down by company, use the saved report Company (see below).
Period selection
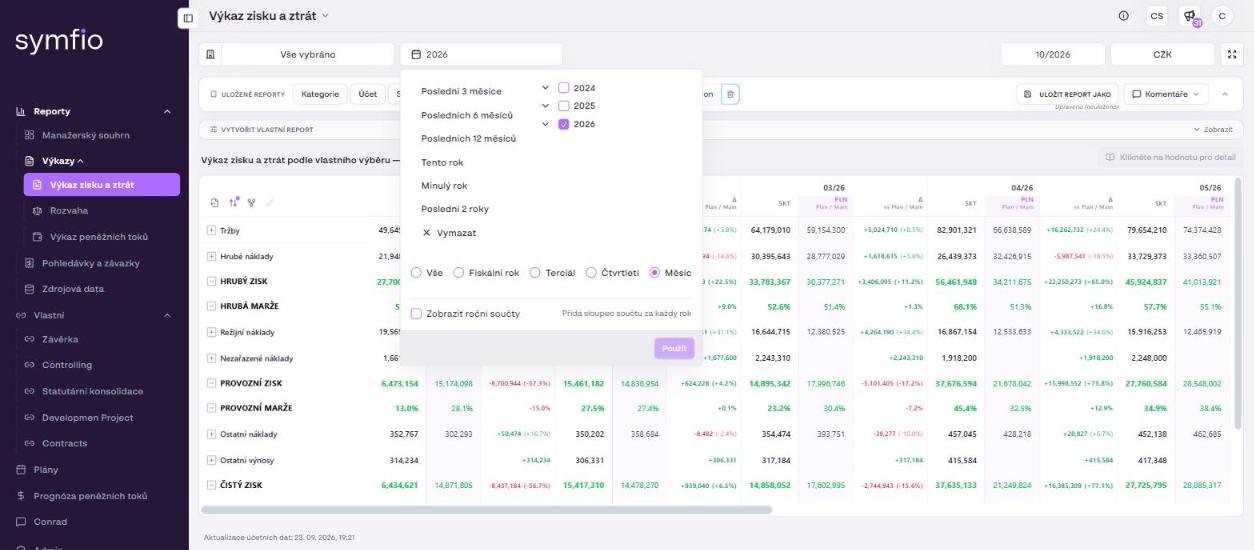
- Click the button with the calendar icon in the toolbar (text such as “2026”).
- Pick a quick range: Last 3 months, Last 6 months, Last 12 months, This year, Last year or Last 2 years. The Clear button resets the selection.
- Optionally select specific years (2024, 2025, 2026 … or All).
- Set the column granularity: Fiscal year, Tertial (four-month period), Quarter or Month.
- Turn on Show yearly totals (Zobrazit roční součty) if you want a total column added for each year.
- Confirm with Apply.
The table columns then follow the chosen granularity, for example 01/26, 02/26 … for months.
Closing month, currency and fullscreen
- Closing month (for example “10/2026”) – the last month up to which data is shown. Set it to the last month that has actually been closed so that an incomplete current month does not distort the trend.
- Currency (“CZK” button) – converts the whole statement into another currency. Foreign-currency entities are converted at a fixed yearly rate (see Source data › Exchange rates).
- Fullscreen – hides the menu and header for presenting.
Saved reports and filters
Expand the Saved reports and filters bar with the Show button. It contains predefined views and tools for saving your own setup.
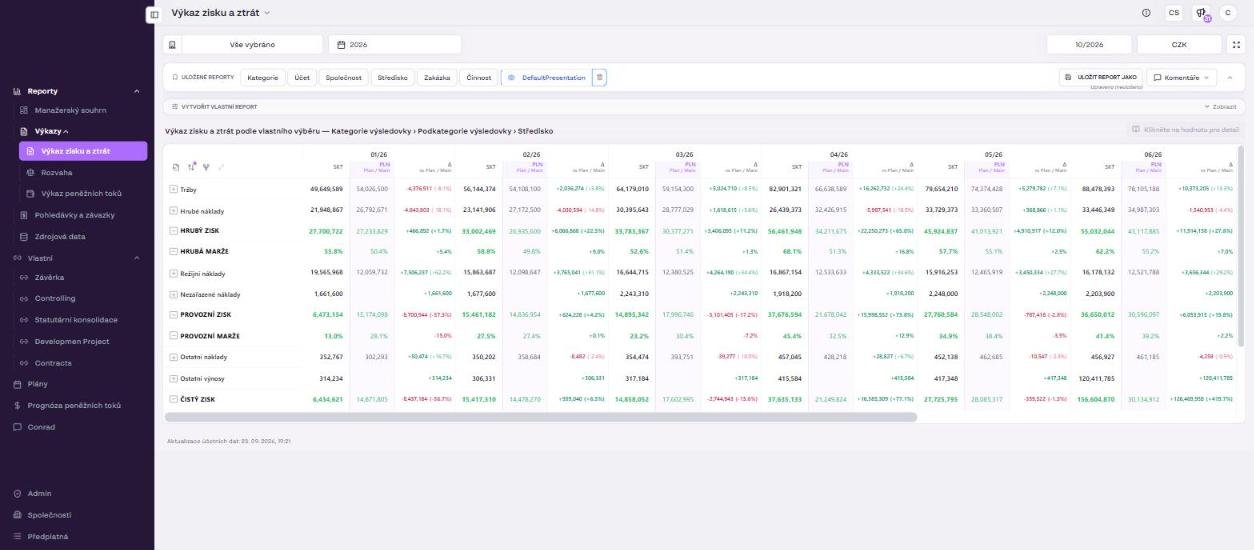
Saved reports (chips)
Each chip switches the row hierarchy to one dimension. The current hierarchy is always shown in the view title under the toolbar, for example Income statement by custom selection — Income statement category › Income statement subcategory › Cost centre.
| Saved report | When to use it |
|---|---|
| Category (Kategorie) | The standard management view: category › subcategory (Revenue, Gross costs, Overheads …). The default choice for monthly reporting and for checking the mapping. |
| Account (Účet) | View by chart-of-accounts account. Use it when reconciling with the books or looking for a specific account. |
| Company (Společnost) | Breakdown by company when several entities are selected. Suitable for group reporting and comparing subsidiaries. |
| Cost centre (Středisko) | Values by cost centre (department, branch). For cost controlling and responsibility reporting. |
| Project (Zakázka) | Values by project or job. For project-based companies and tracking project profitability. |
| Activity (Činnost) | Values by activity (segment). For companies with several lines of business. |
| DefaultPresentation | The default presentation view to return to when you have “broken” a work-in-progress statement. |
| Other chips (for example IntercompanyEliminationCheck, “+99”) | Your organisation’s own saved reports, for example the intercompany elimination control view in the Balance sheet. |
Saving your own setup
- Set the companies, period, granularity and hierarchy the way you need them. The indicator Modified (unsaved) (Upraveno (neuloženo)) appears in the bar.
- Click Save report as and name the report.
- Next time, open the report with a single click on its chip.
- Comments – toggles the display of comments on statement values.
- Create custom report – opens a wizard in which you choose your own order of row dimensions (for example Income statement category › Cost centre › Account).
Working with the table
Icons above the table
In the top-left corner of the table there are four icons (names appear on hover):
- Export data – downloads the current view to Excel.
- Sorting – sorts rows by value.
- Expand to the next hierarchy level – opens all rows one level deeper.
- Collapse one level – closes the lowest open level.
Each row has a + (Expand) or − (Collapse) icon for working with individual branches of the hierarchy.
ACT, PLN and Δ columns
In the Income statement each period has three columns if the company has a plan:
| Column | Meaning |
|---|---|
| ACT (SKT) | Actuals from the accounting system. |
| PLN “Plan / Main” | The planned value from the Main scenario of the income statement plan. |
| Δ “vs Plan / Main” | The difference between actuals and plan, in absolute terms and in per cent. A positive difference is shown in green, a negative one in red. |
Statement subtotals (GROSS PROFIT, OPERATING PROFIT, NET PROFIT, EBITDA, TOTAL COSTS) are in bold; margins (GROSS MARGIN, OPERATING MARGIN, NET MARGIN, EBITDA MARGIN) are in per cent.
Value detail (drill-down)
- Note the Click a value for detail (Klikněte na hodnotu pro detail) button above the table on the right.
- Click any number in the table.
- Review the accounting entries (transactions) that make up the value – document, text, amount, account and contra account.
Footer
At the bottom of every statement you find Accounting data updated (Aktualizace účetních dat) with the date and time of the last data load from the accounting system. If you expect newer figures, check this time first.
Tips and common mistakes
Tip: For a year-on-year comparison set Last 2 years, granularity Month and turn on Show yearly totals. For a board report, Quarter granularity is enough.
Caution: The Modified (unsaved) indicator means the current setup disappears when you close the page. Use Save report as if you want to keep it.
Note: The PLN and Δ columns appear only when the selected company has an income statement plan with a Main scenario for the given period.
Frequently asked questions
Why do I see an Unassigned costs row in the table?
Some cost accounts have no income statement category or subcategory assigned under Categorization › Mappings. Click the value to identify the accounts and complete the mapping.
How do I compare two companies side by side?
Select both companies in the company selector, confirm with Apply and choose the saved report Company. Alternatively, use Create custom report and put the Company name dimension on the first level.
Does the export contain only expanded rows?
The export is based on the current view. Before exporting, expand the hierarchy to the required depth with the Expand to the next hierarchy level icon.
Can I share a saved report with colleagues?
Saved reports are available in the Saved reports and filters bar to users with access to the company. For permanent presentation views use a custom static report in the Custom menu.